


| Excel Project 2 Pivot Tables |
| What did I learn from this Excel Project: |
|
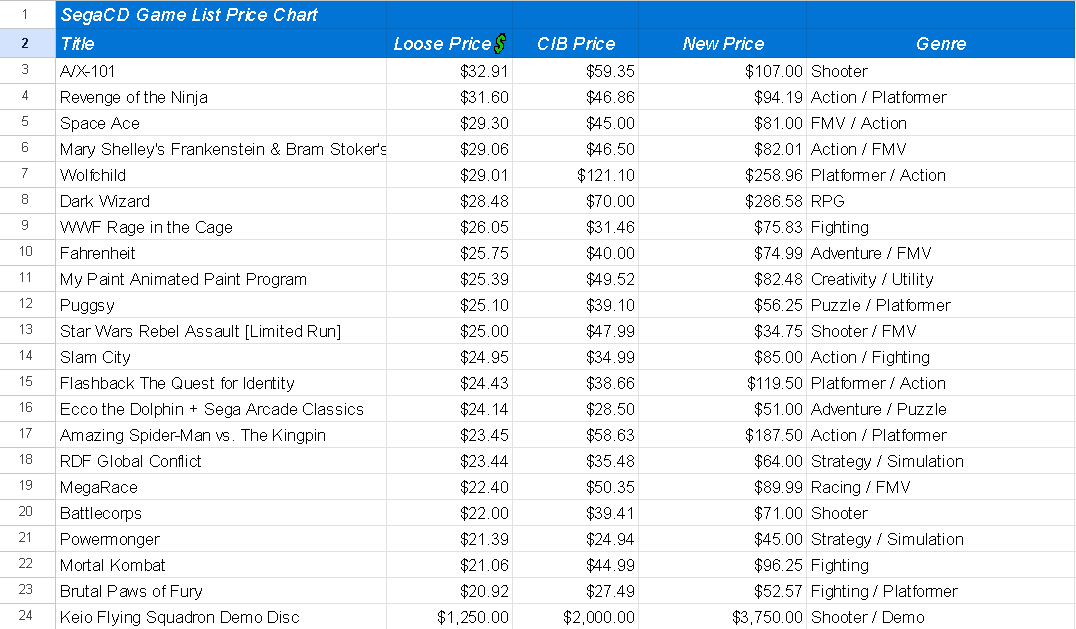
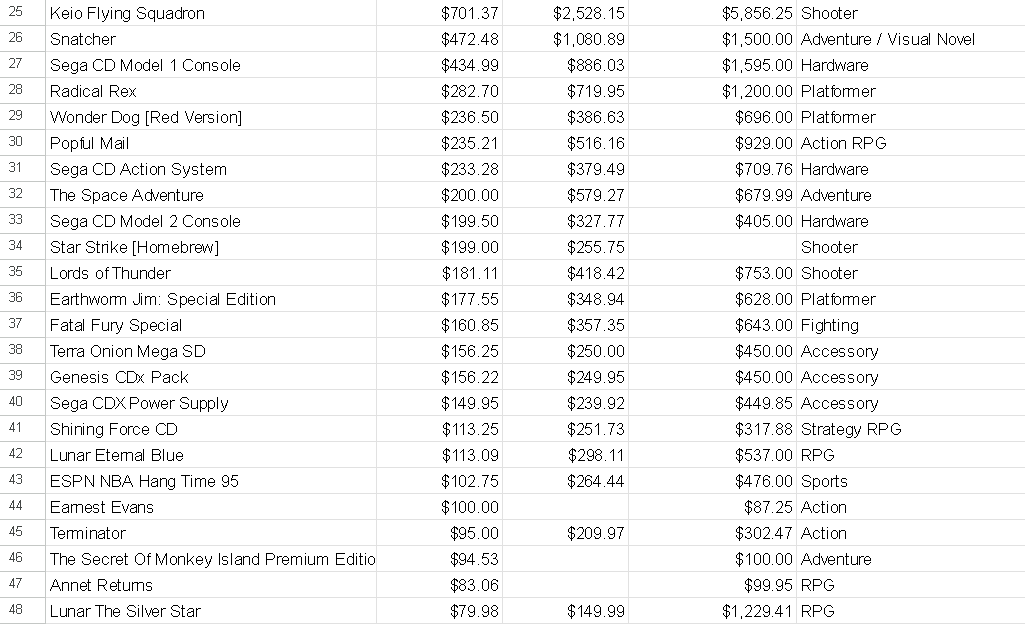
Purpose: Summarizes and analyzes large amounts of data by grouping and aggregating (sum, count, average, etc.) based on selected categories. Example: To summarize total sales by Region and only see sales greater than 100 The Pivot Table will display the total (sum) of sales for each region, filtered to include only records where sales exceed 100. |